TVL vs. Executable Depth: How to Assess Tokenized-Stock Liquidity
A funded pool does not guarantee a useful quote. Learn how trade size, liquidity placement, inventory and execution routes determine whether a tokenized-stock market can serve investors.

A pool can hold $1 million and still deliver an expensive $50,000 trade. To assess the market, ask how much an investor can buy or sell within a stated execution-cost limit.
Total value locked (TVL) measures the value of deposited assets. Executable depth measures the trade size available within a defined threshold at a particular time. A capital total is useful context; an executable quote tells the investor what that capital can do.
For a Tokenized Securities Venue (TSV), the commercial question is whether the market can support the trade sizes its intended participants need. That requires an execution target before launch and a way to measure it as inventory and prices change.
Define what the quote is being compared with
Three measurements answer different questions:
Price impact against the starting pool price measures how far the order’s average execution moves from the pool’s pre-trade price.
Execution against an external reference compares the fill with a chosen outside benchmark at a specified time.
Slippage against the submitted quote measures the difference between the quote the participant accepted and the execution they actually received.
A quote with little pool price impact may still be poor against an external benchmark. A slippage limit protects the accepted execution terms; it does not establish that the original quote was competitive.
Every comparison should state direction, size, timestamp, benchmark and costs included. If the payment asset can move against the dollar, state the conversion method as well.
A venue’s target might take this form: support an agreed order size in each direction within a specified cost limit against a named reference, during defined operating conditions. The size and limit should come from the intended participant use case and available capital. They are design inputs, not universal standards for a TSV.
Start with a simplified constant-product pool
Suppose a pool holds 5,000 stock tokens and $500,000 of a dollar-valued payment asset. At $100 per token, its initial TVL is $1 million.
The following examples exclude fees, other liquidity, replenishment and external trading. Each purchase and sale starts independently from those same reserves. They illustrate constant-product mechanics, not a Steer strategy or a typical tokenized-stock execution result.
A $10,000 purchase receives approximately 98.04 stock tokens at an average price of $102.00. That is 2.00% above the starting $100 price.
A $25,000 purchase receives approximately 238.10 tokens at an average price of $105.00, or 5.00% above the starting price.
A $50,000 purchase receives approximately 454.55 tokens at an average price of $110.00, or 10.00% above the starting price. The pool still began with $1 million in assets; the larger order simply faced a much less favorable average price.
Selling shows the other side of the service:
Selling 100 stock tokens, worth $10,000 at the starting price, returns approximately $9,803.92. The average sale price is $98.04, or 1.96% below $100.
Selling 250 stock tokens, with a starting-price value of $25,000, returns approximately $23,809.52. The average sale price is $95.24, or 4.76% below $100.
Selling 500 stock tokens, with a starting-price value of $50,000, returns approximately $45,454.55. The average sale price is $90.91, or 9.09% below $100.
The purchase examples specify cash spent; the sale examples specify tokens sold. Their starting-price notionals make the scale comparable, but they are not identical input orders.
Concentrating the same capital changes the quote
Now place the same 5,000 tokens and $500,000 in one idealized concentrated-liquidity position spanning prices from $80 to $125, starting at $100.
The endpoints are symmetric in ratio around $100. That allows this position to hold equal dollar values of both assets initially. The calculation uses the Uniswap v3 concentrated-liquidity model, ignores tick rounding and fees, and assumes no other positions or trading during the order.
For a $10,000 purchase, the average price falls from $102.00 in the full-range constant-product example to approximately $100.21 in the concentrated position.
For a $25,000 purchase, the average price falls from $105.00 to approximately $100.53.
For a $50,000 purchase, it falls from $110.00 to approximately $101.06. The amount of starting capital has not increased; more of it is available to support trading near the current price.
For these orders, the concentrated position supplies more executable depth near $100.
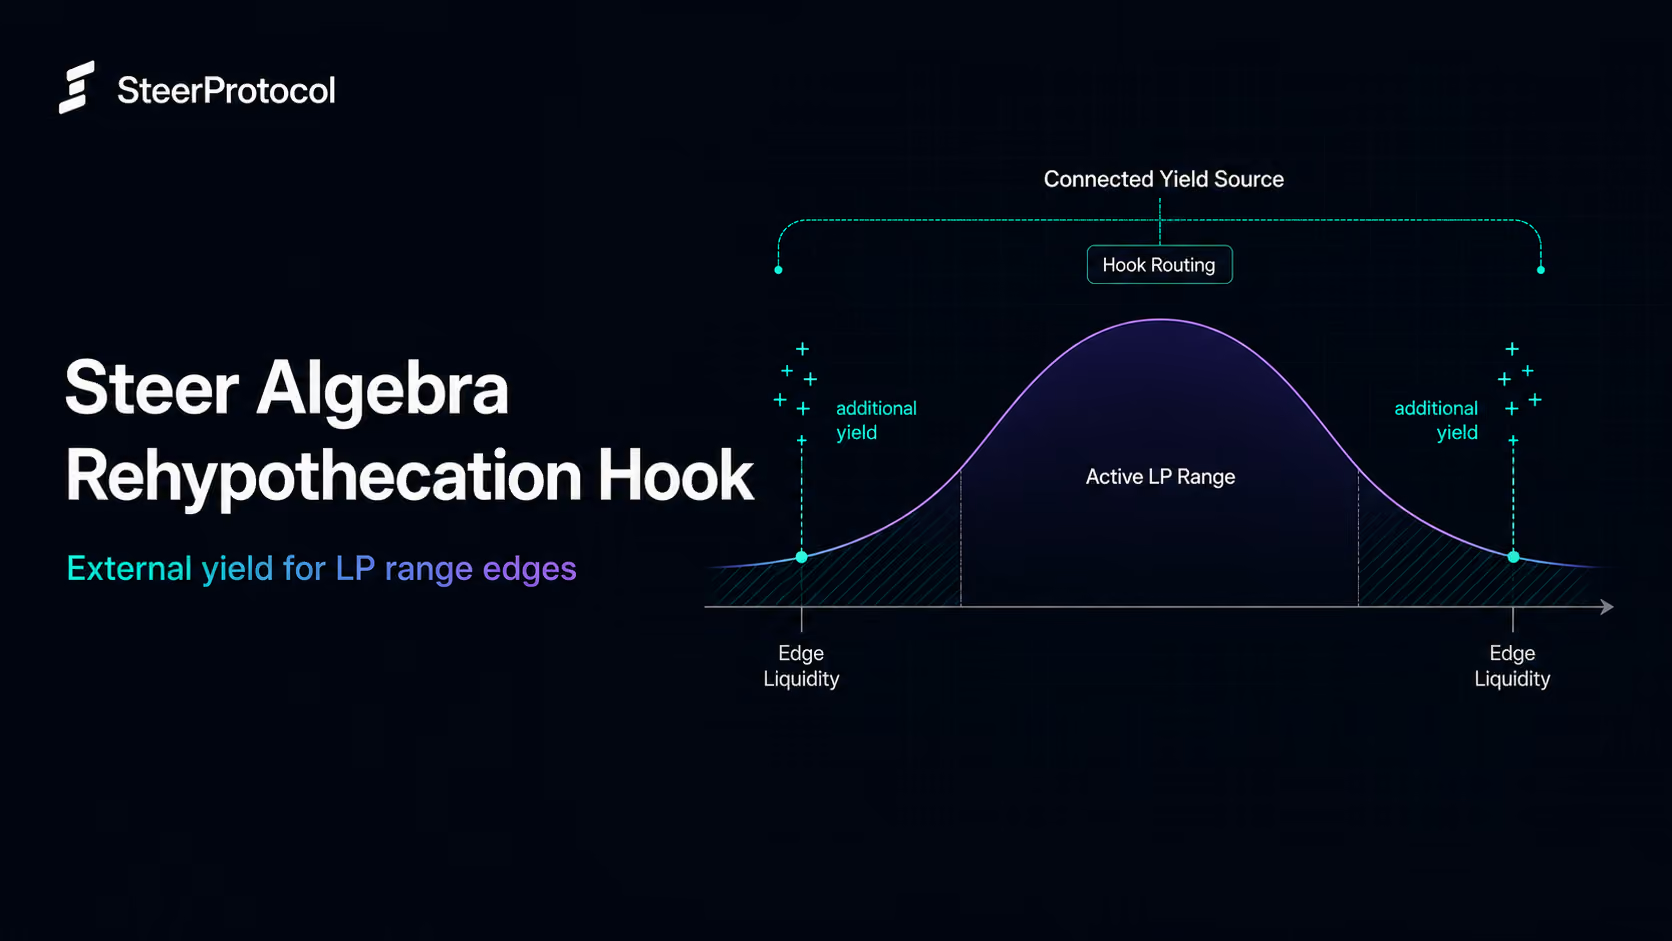
The trade-off is coverage. The position does not provide active liquidity outside its range. Other positions may serve those prices, but this example includes none. The calculation therefore demonstrates local depth, not continuous availability or superior LP returns.
Actual markets require evaluation of all active positions, fees, inventory, permissions and transaction costs.
Test the market after it has been used
A launch snapshot does not establish tomorrow’s execution quality. Repeated buying reduces available stock; repeated selling consumes the payment asset. Changes in the external market may also leave a previously useful quote far from the relevant benchmark.
Repeat the intended buy and sell orders after directional flow, a reference-price move and a delayed strategy action. Record which condition causes the service target to fail and what restores it.
For the launch decision, retain the starting state, test order, resulting quote and recovery action for each scenario. A venue seeking $25,000 trades should be able to identify when that size stops meeting its target and what restores it.
If the target fails, the remedy may involve more capital, different placement, a smaller supported order or faster replenishment. The test results help the venue and its liquidity partner choose among those trade-offs.
Check whether the liquidity is sustainable for its providers
A competitive quote has to work for the capital behind it. Liquidity providers earn fees but also carry changing inventory, execution costs and exposure to better-informed trading. When a pool quotes against a stale reference, traders may take its favorable side before the strategy can adjust.
Measure the provider’s net result after management, transaction and replenishment costs, including hedging costs where applicable. Compare it with a clearly defined benchmark, such as holding the same opening assets without providing liquidity. State how deposits and withdrawals are treated so that additional funding is not mistaken for a return.
Steer’s APR and APY documentation distinguishes fee APR from the wider investment result: fee APR excludes changes in asset value and swap or rebalancing costs. A high fee figure alone does not establish a sustainable liquidity arrangement.
The venue and capital provider should agree both the trading objective and the economic limits within which it will be pursued.
Put execution quality in the venue’s operating report
Ask for quotes at agreed sizes in both directions, with the benchmark and all included costs identified. Alongside them, request the inventory split, active price ranges, reference-data age and time of the last successful strategy action.
Track how often the agreed orders meet the target, the duration of shortfalls and the cost of restoring depth. Define the quote-sampling interval and data coverage so that a quiet period or missing observations cannot look like uninterrupted service. These are proposed management measures, distinct from any required venue reporting.
How Steer helps a venue build useful depth
Executable depth depends on how orders reach available supply, where capital is placed and how the operation responds when conditions change. Steer provides infrastructure across those functions.
Connect demand to available supply. Steer’s hook architecture connects eligible orders from supported trading channels to pool liquidity and supported issuer processes. Where an authorized route can deliver within the order’s execution and settlement terms, accessible capacity may extend beyond tokens already sitting in the pool. Capacity that is delayed, unfunded or unavailable to the participant should not be counted as executable depth. For TSV projects, secondary execution and any separate issuer or replenishment process must be scoped explicitly.
Place and adjust committed capital. Smart Pools and the Dynamic Rebalance framework provide controls for range placement, width, distribution and adjustment triggers. Teams can evaluate configurations against the same trade sizes, capital, benchmarks and stress conditions, then measure the depth and exposure each configuration produces.
Bound the actions used to maintain the market. Steer Matador provides programmable permissions for supported smart accounts. Operators and automation can be limited to approved calls, value limits and defined conditions. For a liquidity operation, this helps put boundaries around the delegated actions used to pursue its execution objective. It does not make market capacity or transaction completion certain.
Make the capital result observable. Steer’s vault-accounting outputs include managed holdings, share supply and accumulated fees. These inputs can support reconciliation and performance analysis alongside the venue’s quote measurements, transaction costs and external activity. Together, they help answer whether the operation is delivering useful trades at an acceptable cost to its capital providers.
The implementation should connect these components to one measurable objective: the orders the market intends to support, under stated conditions and within agreed capital limits.
Evaluating liquidity for a market? Share your asset pair, target buy and sell sizes, execution benchmark and available inventory routes with us to scope the infrastructure and pilot tests.
Recent Insights and Updates
Expand your knowledge with these hand-picked articles, tailored to keep you ahead in the space.

%20(1)%20(1).avif)